2010 Overview
In case you're looking for a quick overview of last year's event, this will help! Using Daytum, a beautiful data collection tool, we created a few (only somewhat nerdy) graphs to help us visualize several statistics from last year.
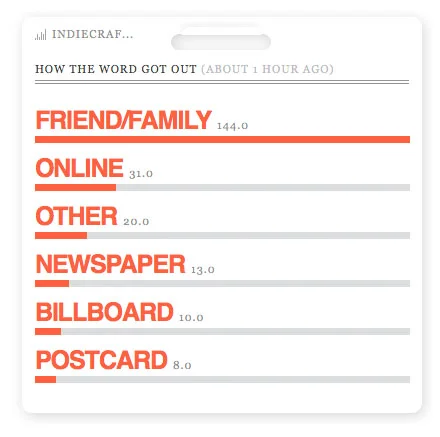
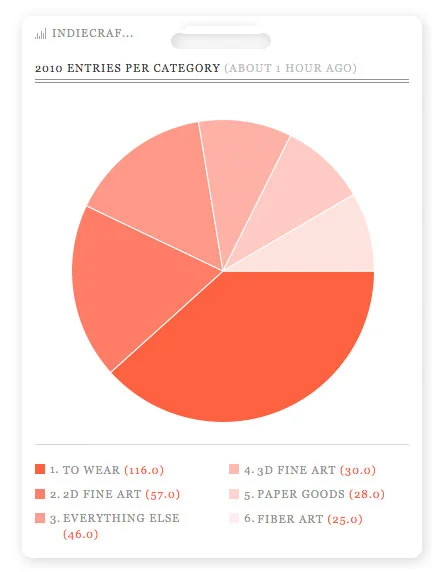
At a glance, you can see how people heard about our 2010 event, and the number of applications we received in each category. My personal favorite graph shows how much experience our vendors had before participating in Indie Craft Parade. You can visit our Daytum page here to see that one and more!